104th Regular Session · current members
Illinois Senate
Democrats hold 40 of 59 seats, a two-thirds supermajority. The typical Democratic member saw 27% of their bills pass, against 7% for the typical Republican.
Majority 30⅔ 40
Republican 19Democratic 40
Senate districts
Boundaries from the U.S. Census Bureau's 2022 cartographic boundary files.
Color by
RepublicanDemocraticVacantClick a district to open its member’s profile.
Loyalty and legislative success
Each dot is a member. Further right means voting with their own party more often when the parties split; higher means more of their authored bills passed both chambers.
RepublicanDemocraticDot size: bills authored
Members
Statistics for the 104th Regular Session. Click a column to sort.
| 1 | 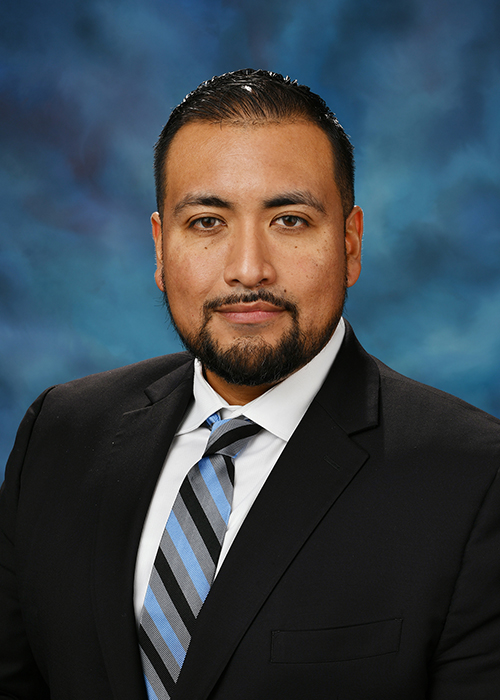 Javier CervantesD | 57 | 28% | 100% | 1.5% |
| 2 | 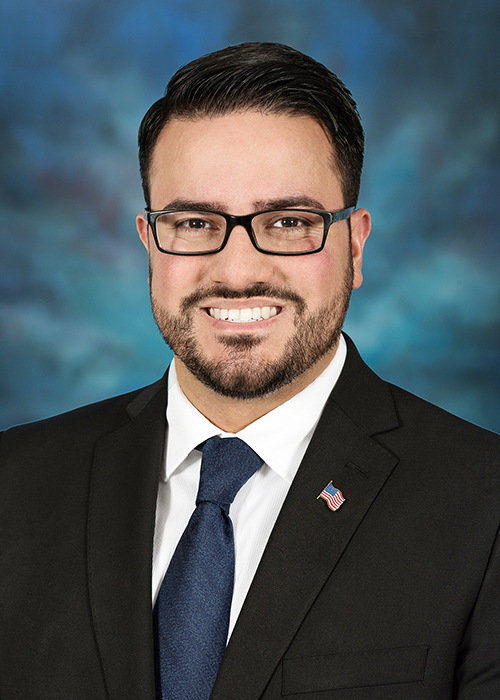 Omar AquinoD | 43 | 30% | 100% | 12.2% |
| 3 | 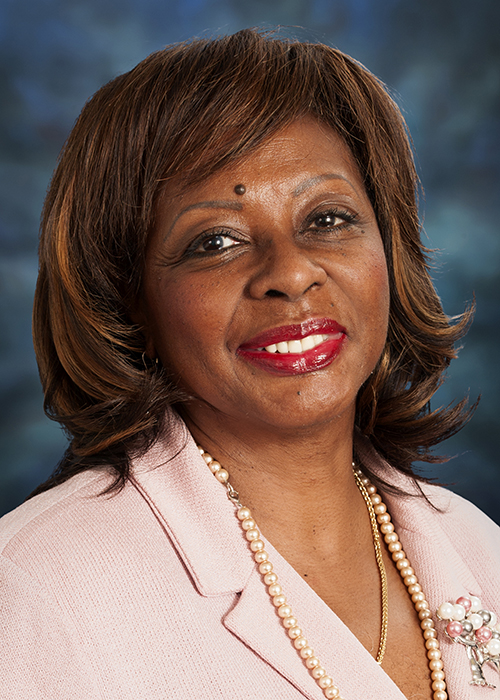 Mattie HunterD | 44 | 27% | 100% | 14.0% |
| 4 | 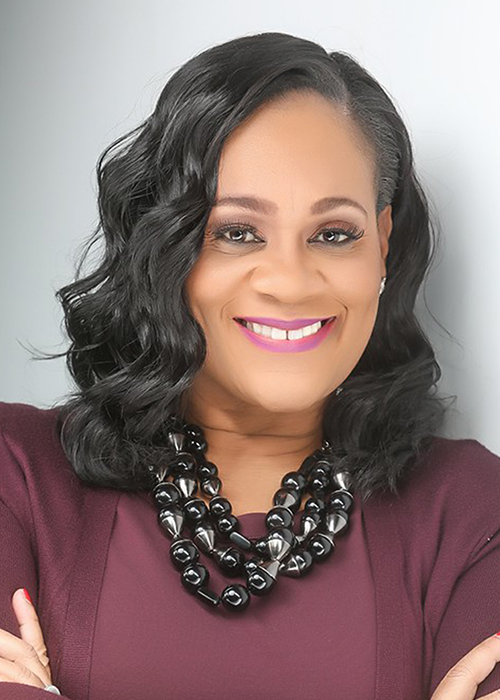 Kimberly LightfordD | 60 | 28% | 100% | 16.4% |
| 5 | 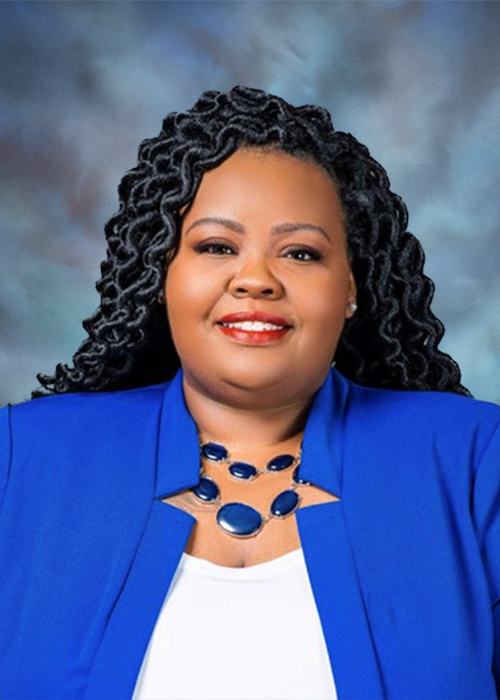 Lakesia CollinsD | 85 | 13% | 99% | 6.0% |
| 6 | 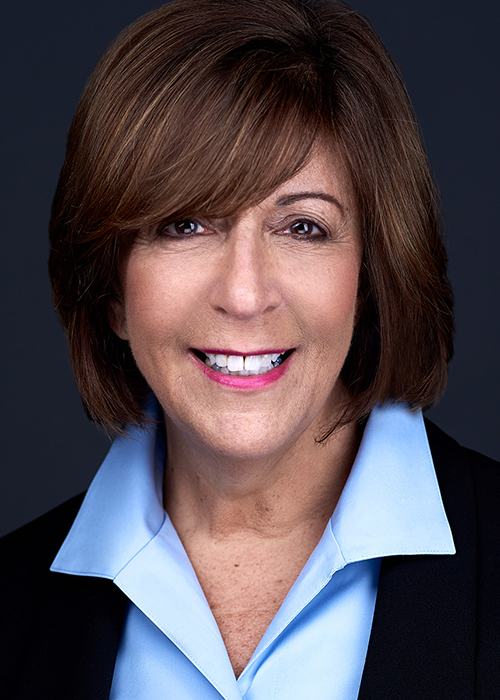 Sara FeigenholtzD | 68 | 29% | 100% | 3.2% |
| 7 | 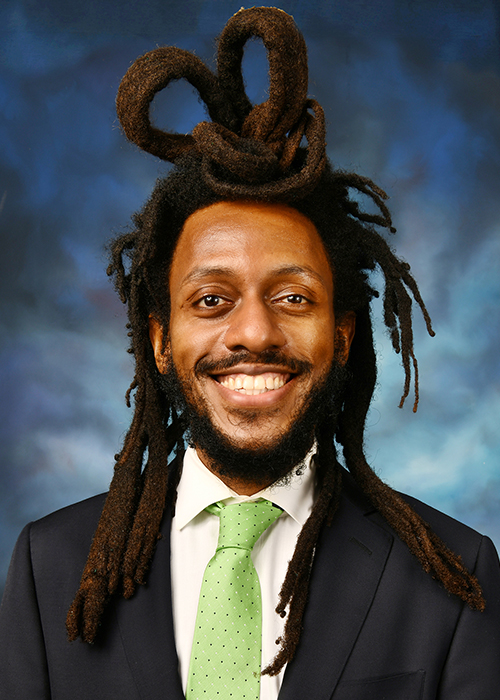 Mike Simmons-GessesseD | 88 | 9% | 100% | 8.7% |
| 8 | 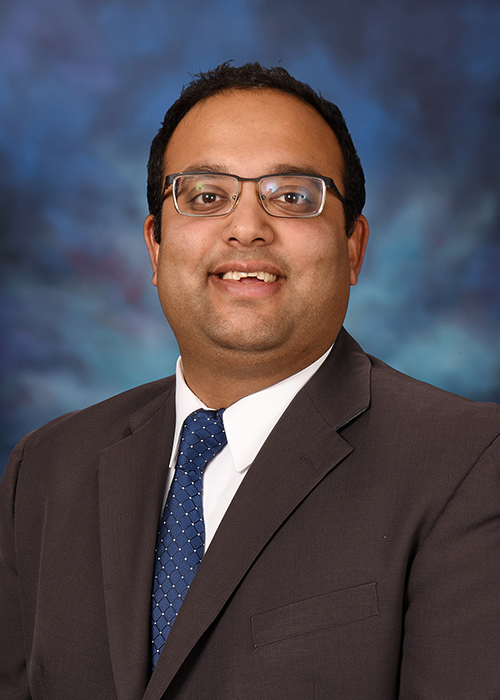 Ram VillivalamD | 120 | 26% | 100% | 3.0% |
| 9 | 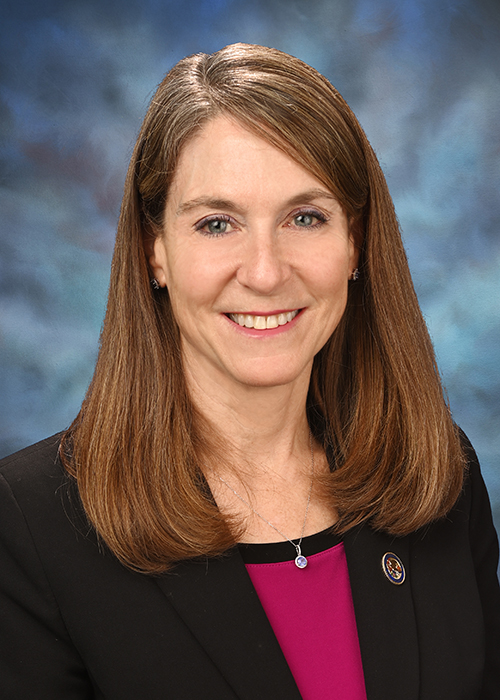 Laura FineD | 88 | 35% | 100% | 10.9% |
| 10 | 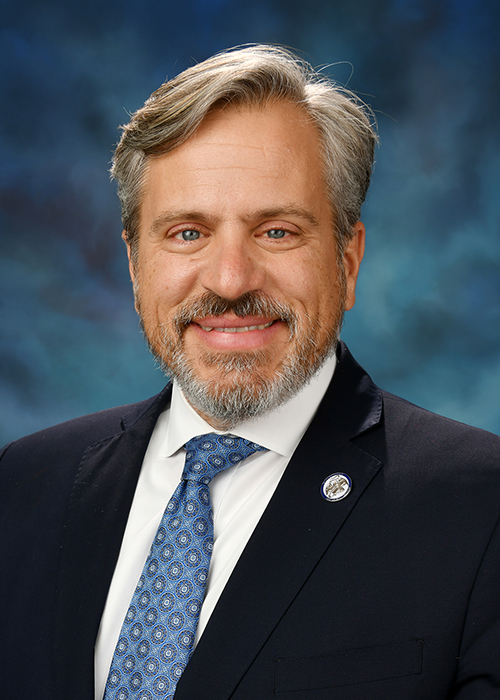 Rob MartwickD | 101 | 18% | 100% | 8.7% |
| 11 | 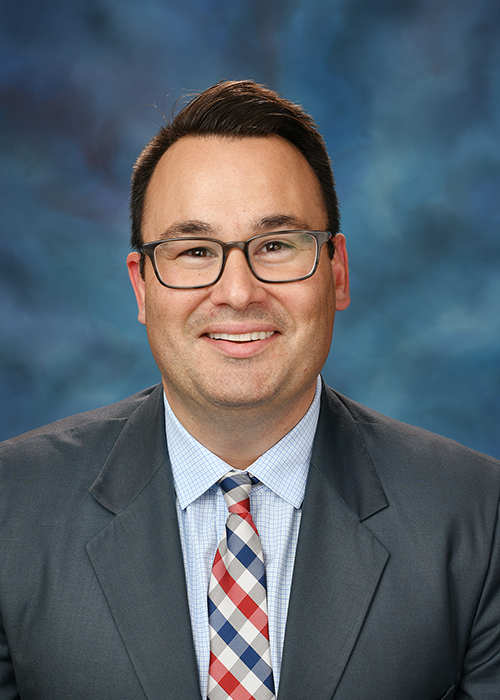 Mike PorfirioD | 87 | 30% | 100% | 9.3% |
| 12 | 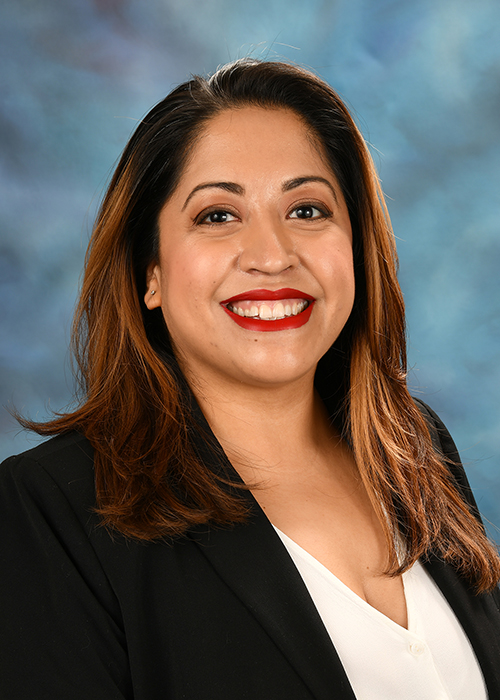 Celina VillanuevaD | 104 | 20% | 100% | 0.3% |
| 13 | 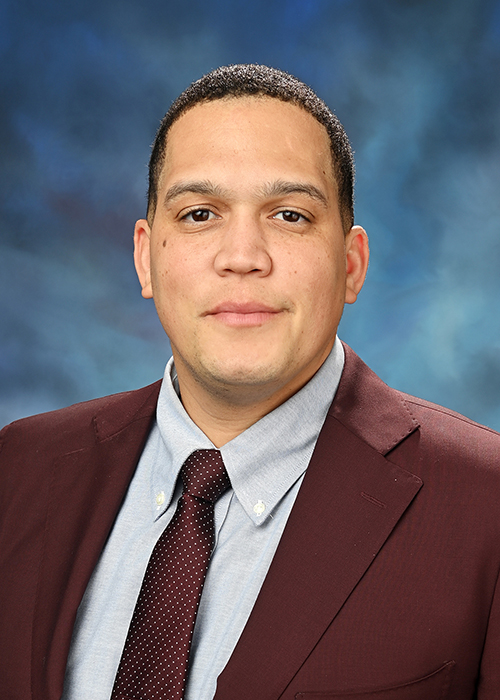 Robert PetersD | 63 | 25% | 100% | 15.8% |
| 14 | 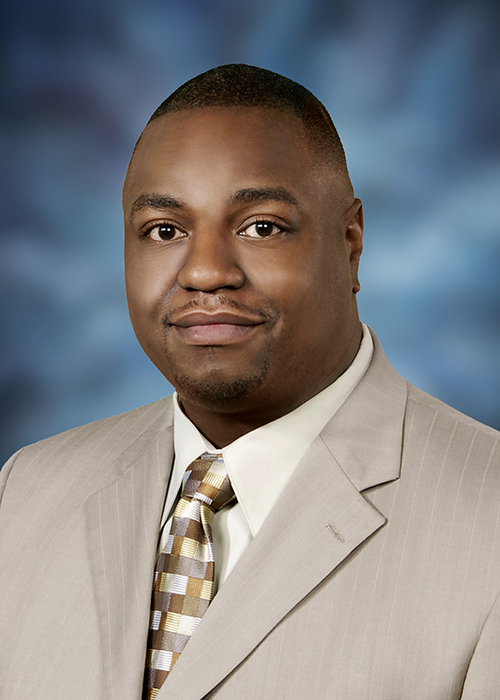 Emil JonesD | 18 | 0% | 99% | 23.4% |
| 15 |  Napoleon HarrisD | 0 | — | 100% | 4.3% |
| 16 | 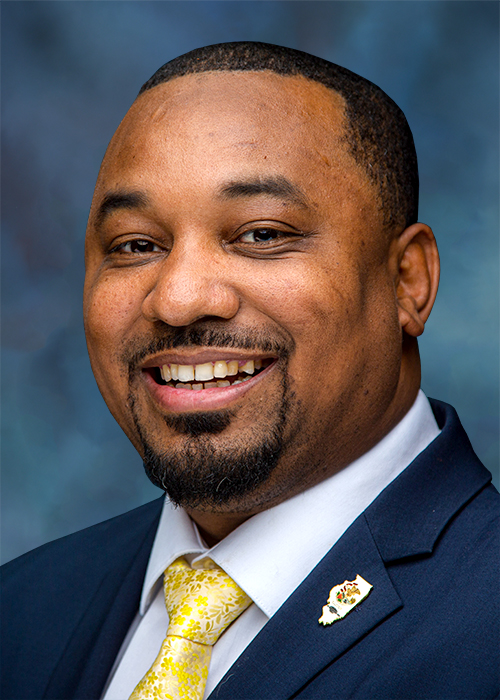 Willie PrestonD | 81 | 10% | 98% | 10.7% |
| 17 | 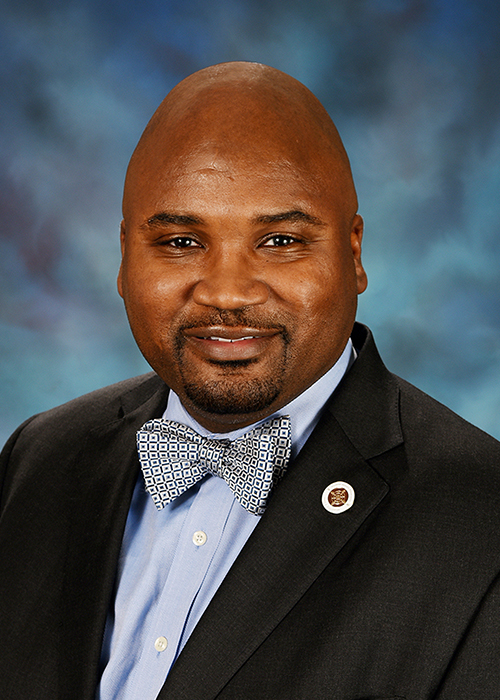 Elgie SimsD | 239 | 5% | 100% | 5.0% |
| 18 | 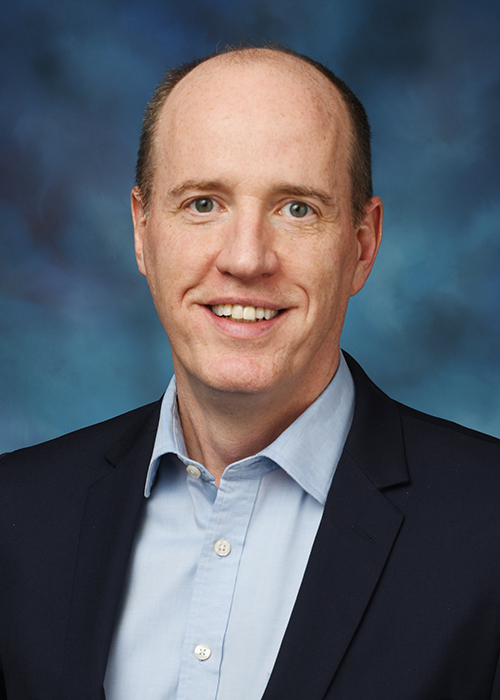 Bill CunninghamD | 97 | 24% | 100% | 1.7% |
| 19 |  Mike HastingsD | 68 | 29% | 97% | 4.4% |
| 20 | 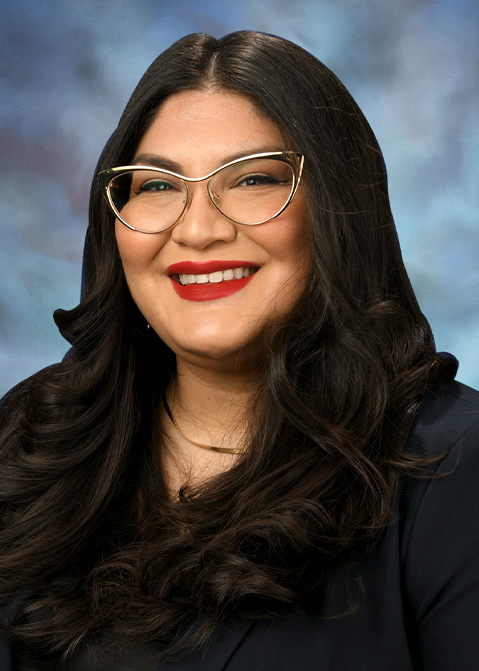 Graciela GuzmánD | 100 | 21% | 100% | 5.3% |
| 21 | 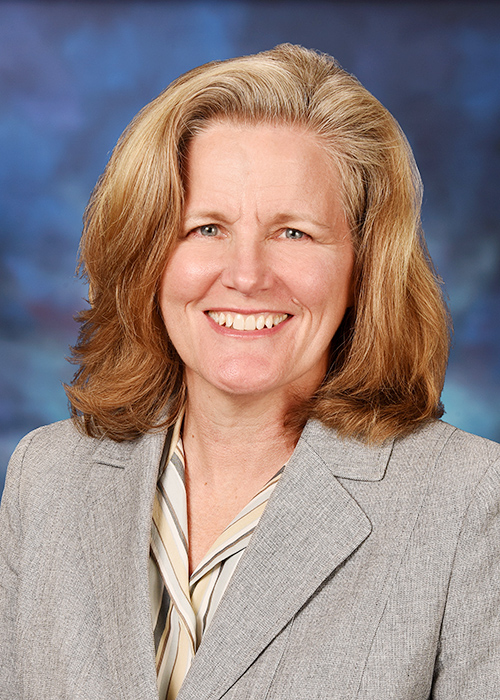 Laura EllmanD | 93 | 30% | 100% | 1.7% |
| 22 | 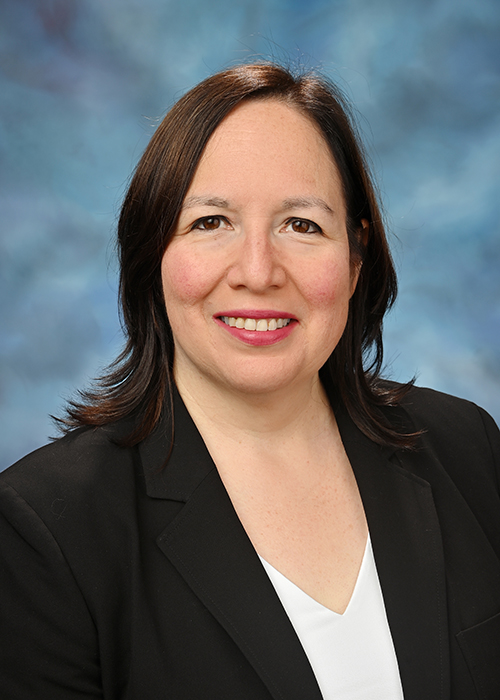 Cristina CastroD | 95 | 21% | 100% | 2.8% |
| 23 | 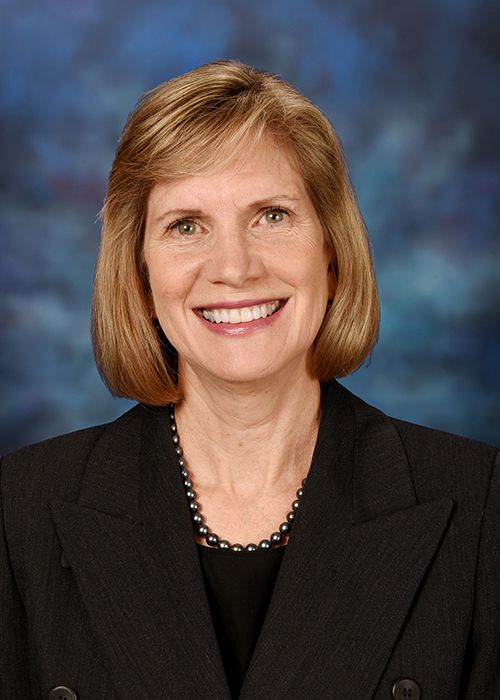 Suzy Glowiak HiltonD | 60 | 38% | 95% | 2.1% |
| 24 | 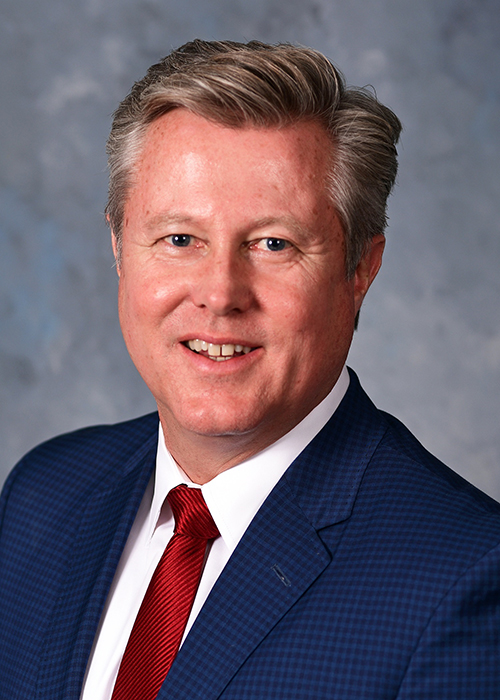 Seth LewisR | 30 | 7% | 62% | 9.2% |
| 25 | 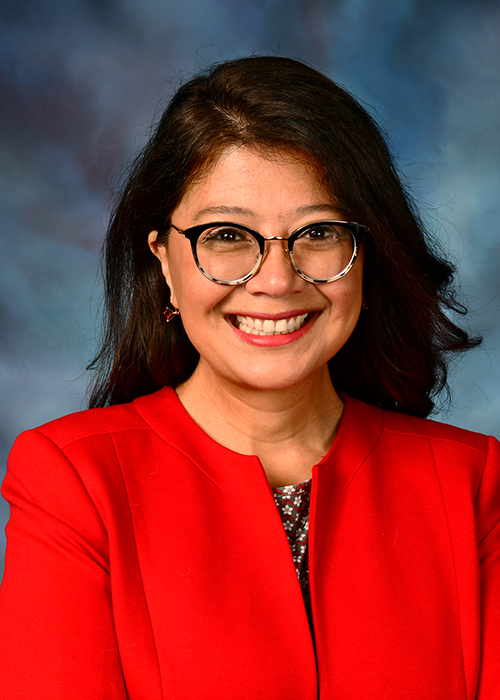 Karina VillaD | 60 | 30% | 100% | 3.2% |
| 26 |  Darby HillsR | 35 | 9% | 64% | 0.8% |
| 27 |  Mark WalkerD | 23 | 26% | 100% | 1.1% |
| 28 | 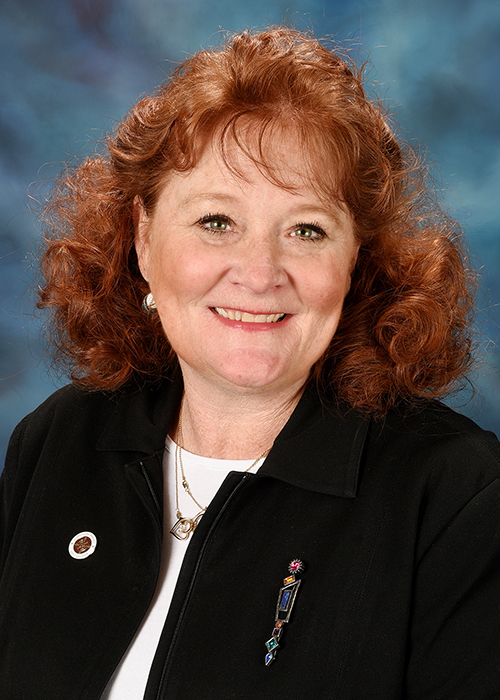 Laura MurphyD | 67 | 31% | 100% | 0.6% |
| 29 | 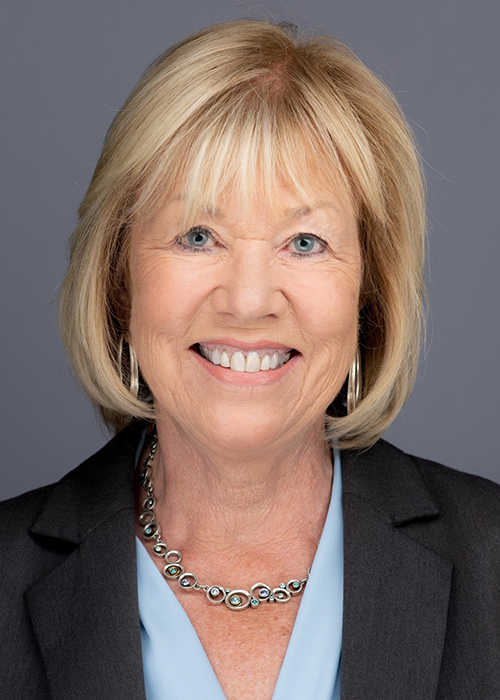 Julie MorrisonD | 135 | 41% | 100% | 3.3% |
| 30 | 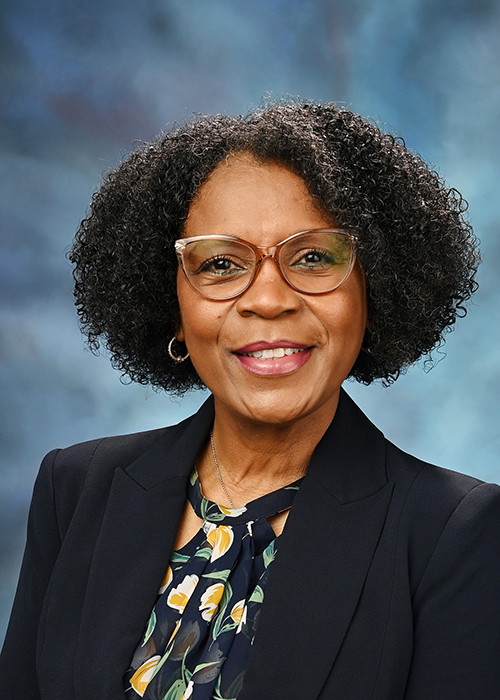 Adriane JohnsonD | 0 | — | 100% | 2.6% |
| 31 | 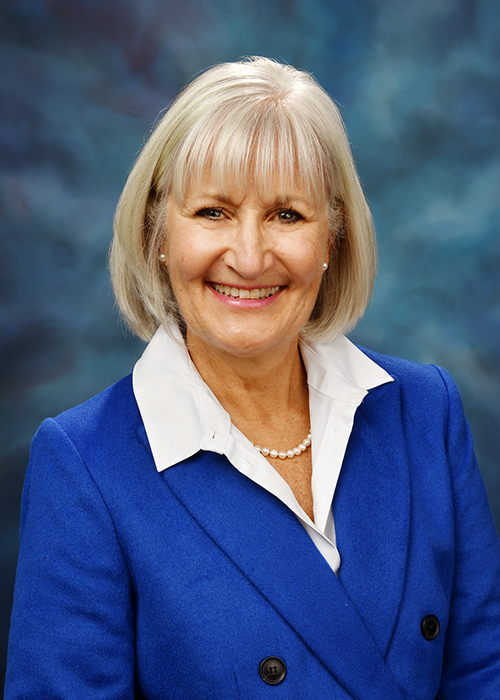 Mary Edly-AllenD | 81 | 26% | 100% | 1.0% |
| 32 | 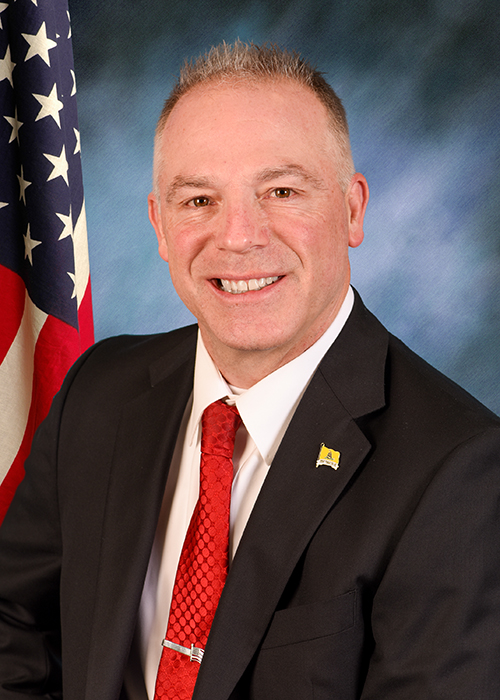 Craig WilcoxR | 15 | 7% | 92% | 10.1% |
| 33 | 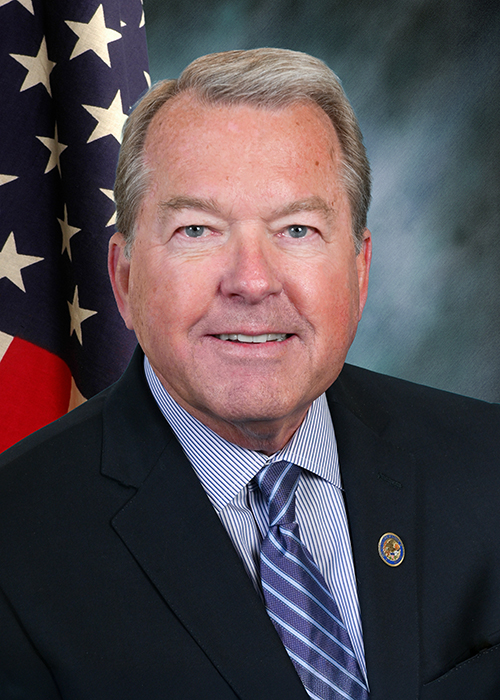 Don DeWitteR | 41 | 22% | 71% | 2.5% |
| 34 | 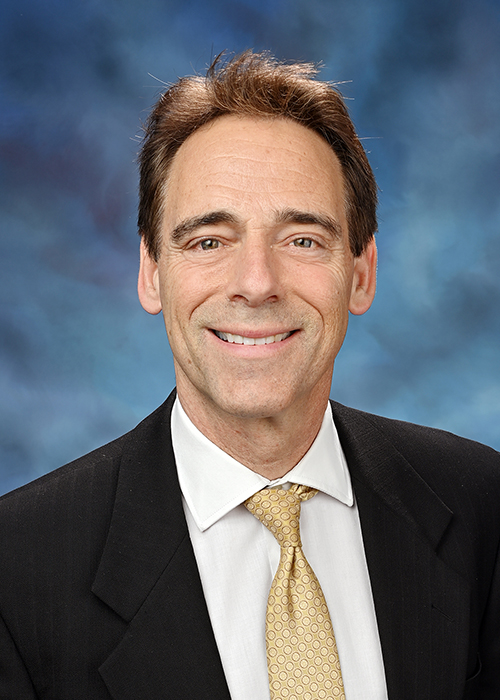 Steve StadelmanD | 55 | 29% | 100% | 2.9% |
| 35 | 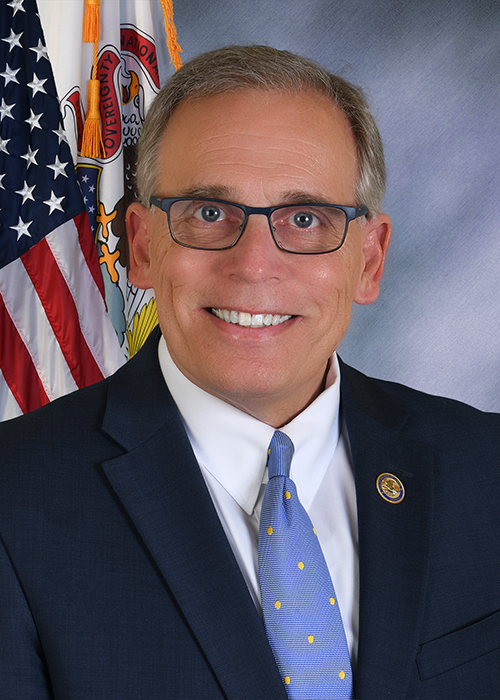 Dave SyversonR | 19 | 11% | 95% | 12.7% |
| 36 |  Mike HalpinD | 103 | 28% | 97% | 4.5% |
| 37 | 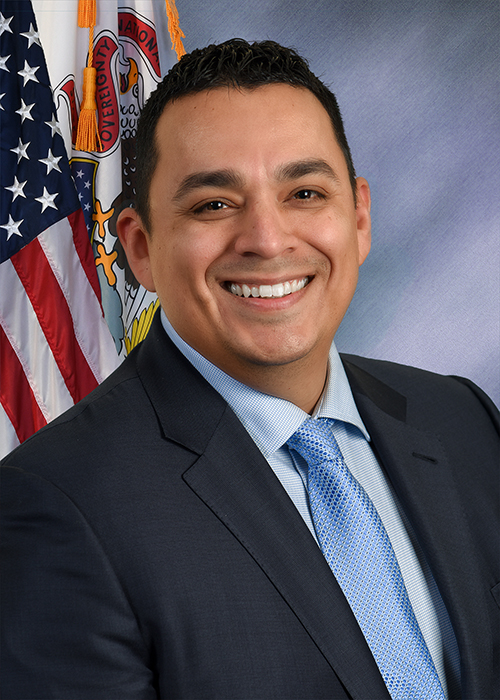 Li ArellanoR | 29 | 21% | 95% | 4.2% |
| 38 | 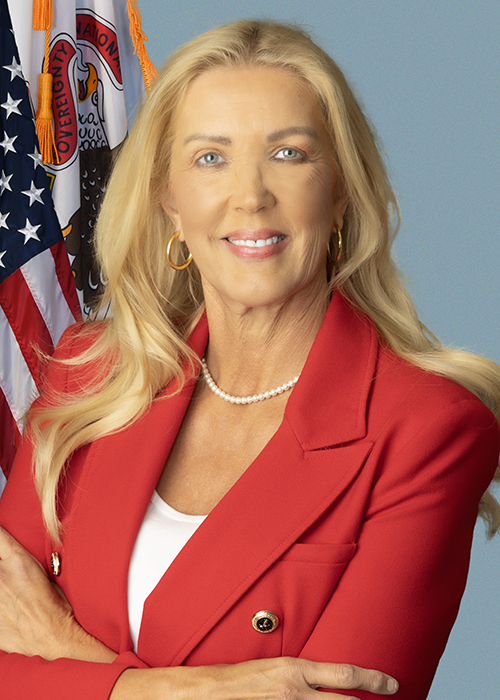 Sue RezinR | 94 | 1% | 81% | 36.2% |
| 39 |  Don HarmonD | 577 | 1% | 100% | 3.7% |
| 40 | 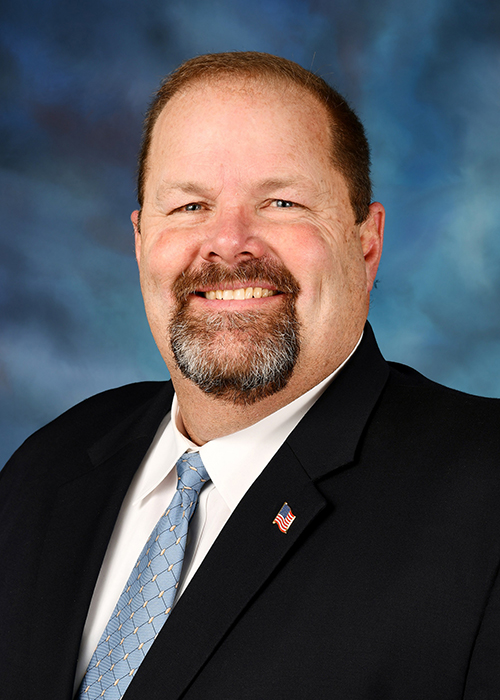 Patrick JoyceD | 85 | 21% | 88% | 2.6% |
| 41 | 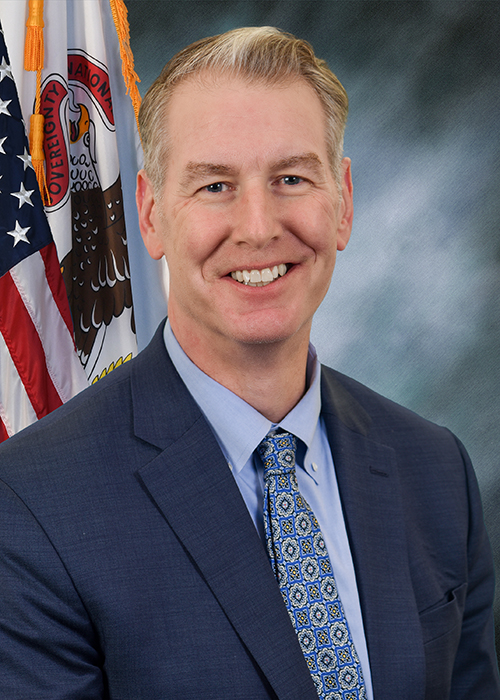 John CurranR | 377 | 2% | 83% | 1.9% |
| 42 | 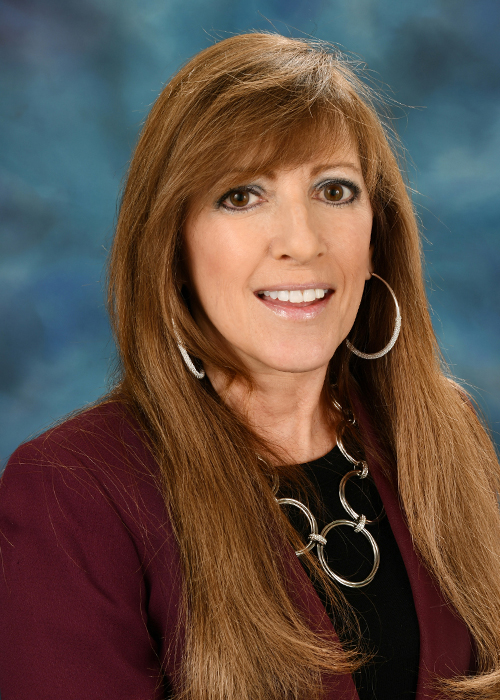 Linda HolmesD | 45 | 22% | 99% | 2.3% |
| 43 | 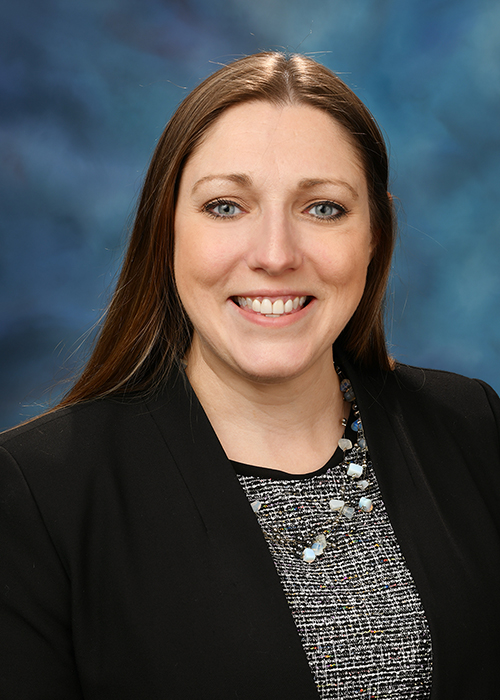 Rachel VenturaD | 75 | 16% | 100% | 2.9% |
| 44 | 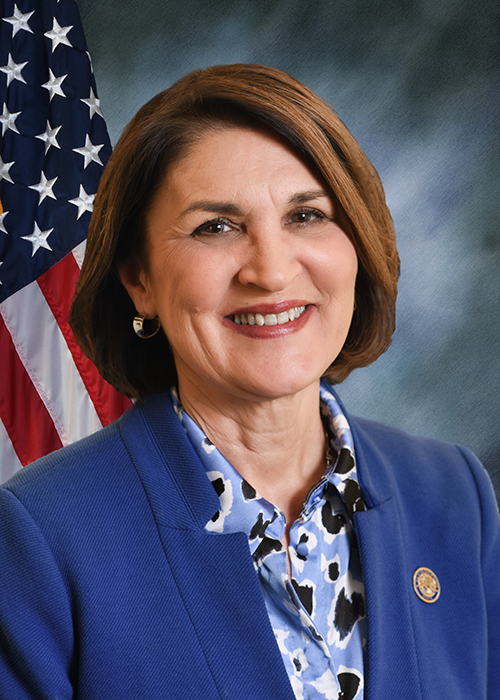 Sally TurnerR | 85 | 7% | 95% | 2.9% |
| 45 | 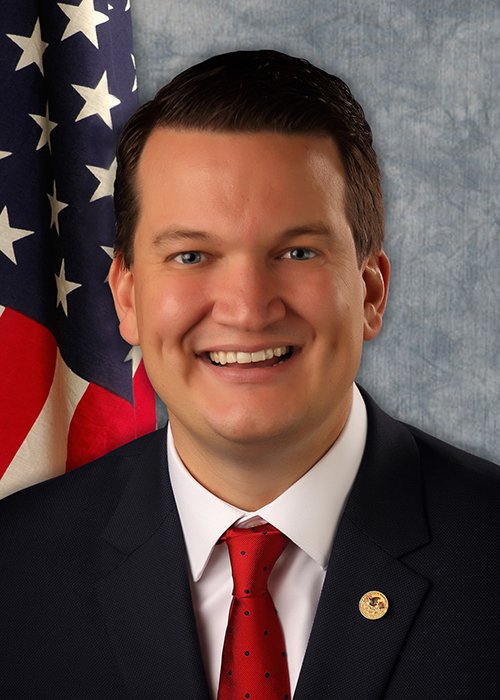 Andrew ChesneyR | 49 | 4% | 98% | 7.3% |
| 46 |  Dave KoehlerD | 84 | 35% | 100% | 0.1% |
| 47 | 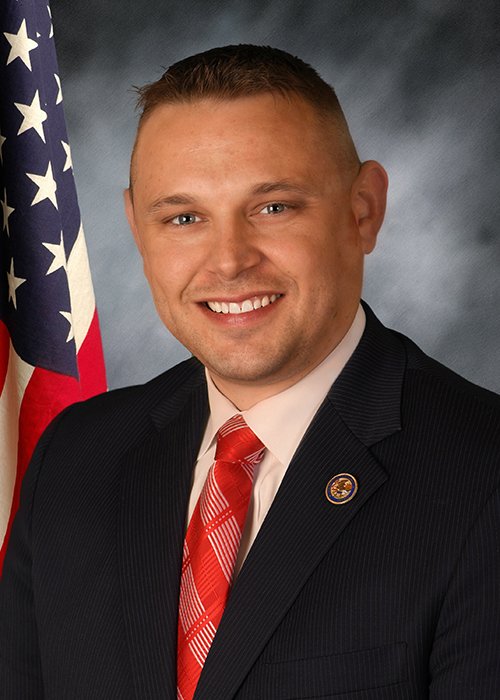 Neil AndersonR | 79 | 13% | 100% | 34.6% |
| 48 | 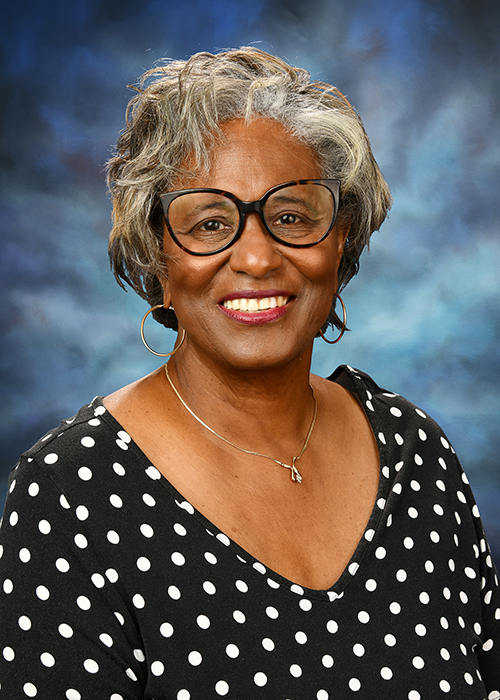 Doris TurnerD | 70 | 31% | 95% | 5.6% |
| 49 | 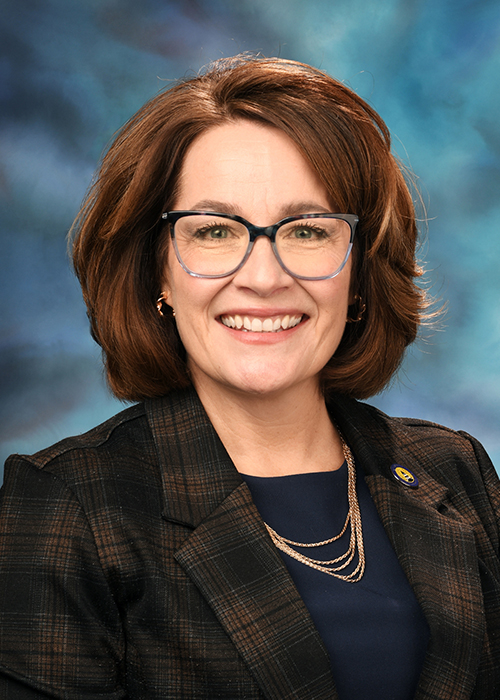 Meg Loughran CappelD | 65 | 43% | 96% | 14.3% |
| 50 | 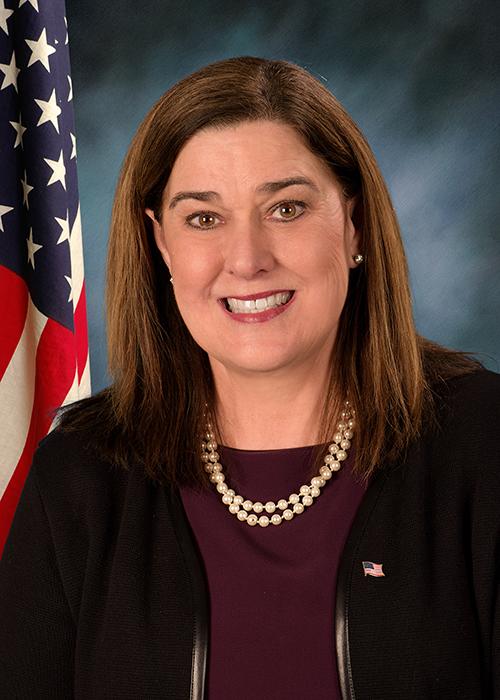 Jil TracyR | 68 | 3% | 96% | 2.3% |
| 51 |  Chapin RoseR | 86 | 2% | 99% | 7.0% |
| 52 | 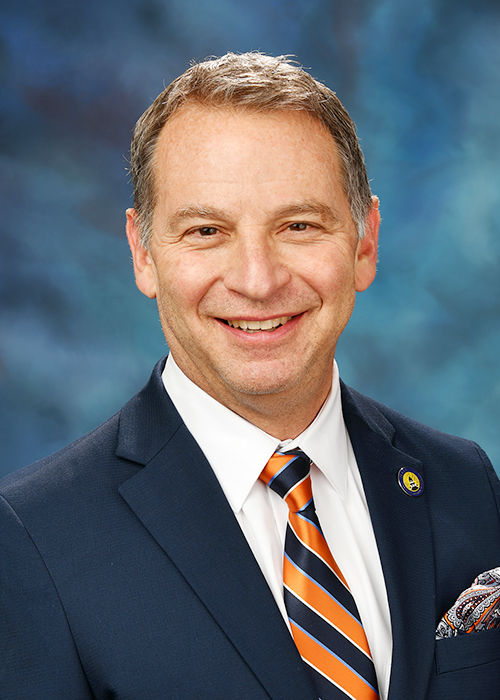 Paul FaraciD | 40 | 28% | 100% | 0.7% |
| 53 |  Chris BalkemaR | 64 | 9% | 95% | 3.9% |
| 54 | 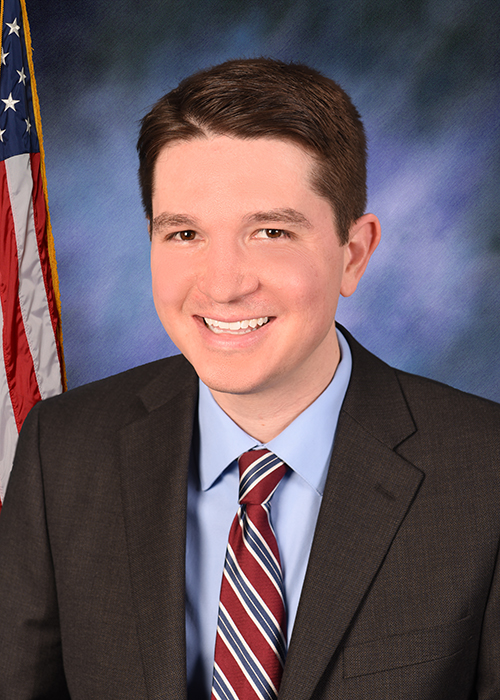 Steve McClureR | 48 | 10% | 95% | 8.1% |
| 55 | 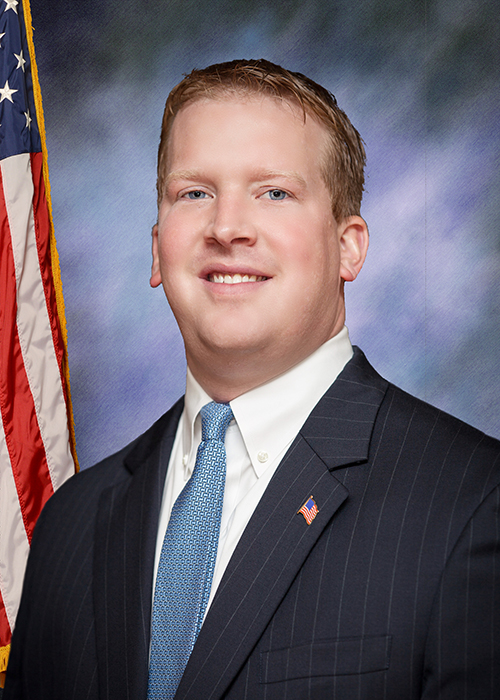 Jason PlummerR | 42 | 2% | 99% | 7.5% |
| 56 | 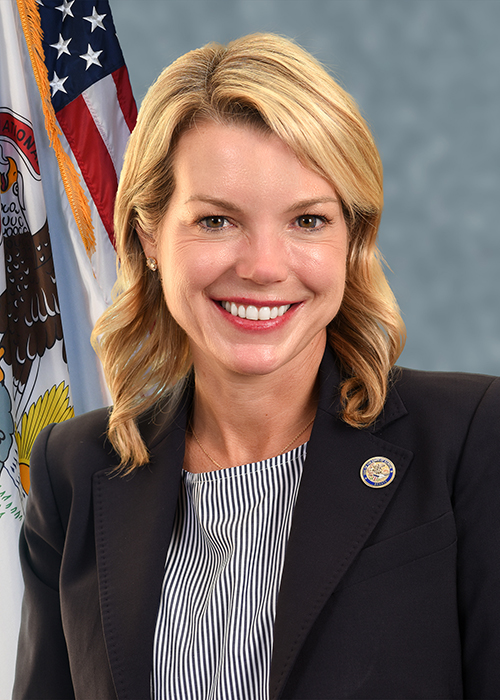 Erica HarrissR | 59 | 22% | 82% | 1.0% |
| 57 | 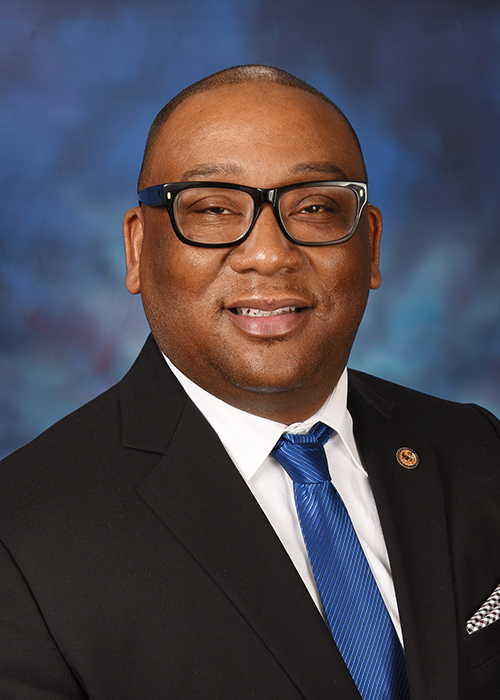 Christopher BeltD | 82 | 35% | 96% | 7.6% |
| 58 | 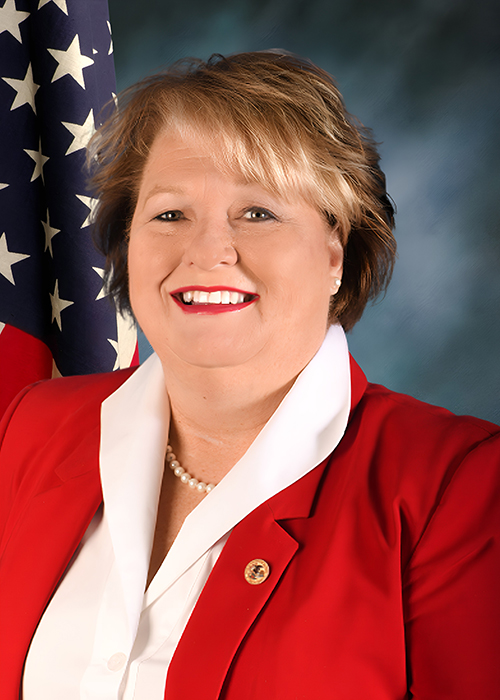 Terri BryantR | 68 | 7% | 96% | 3.5% |
| 59 | 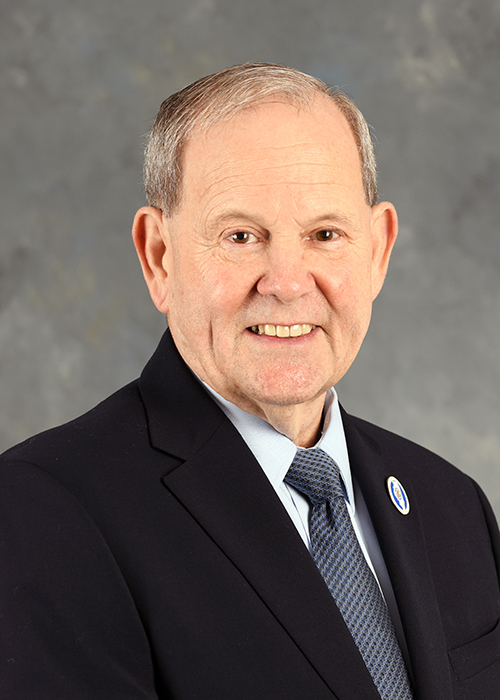 Paul JacobsR | 21 | 5% | 99% | 1.0% |